Dear PGM Capital blog readers,
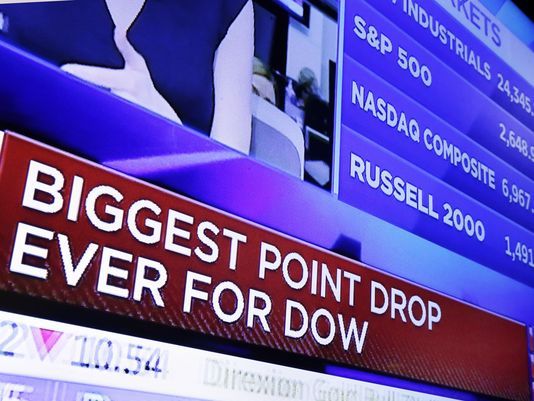
The Dow Jones plunged 1,033 points on Thursday, February 8th, in another volatile day for the stock market. It was the second-worst single-day point drop in history, beaten only by the record set after Monday’s, February 5th, 1,175-point drop.
INTRODUCTION:
The week of February 5, 2018, was a wild one for the stock market.
Each of the major U.S. averages lost more than 5% with the Dow losing more than 1,000 points in a single day twice. Despite a more than 1% rally to cap the week on Friday, February 9, the Dow, S&P 500, and Nasdaq, each lost approx. 5.2%, which made it the worst week for the US stock market, since January 2016.
The Monday February 5 sell-off, was the largest point decline in the Dow’s history as the blue chip index shed 1,175 points, in a chaotic and disorienting trading day.
And by week’s end, both investors and those not steeped in financial markets were left asking the same question.
What just happened?
WHAT TRIGGERED LAST WEEK SELL OFF?
Unlike declines around the debt ceiling in 2011, or concerns over the Chinese economy in 2015, or post-Brexit and post-election market sell-offs seen in 2016, there was no one thing you could point to and say,
“This is what made markets go down.”
A number of factors were at play in markets last week, some of which seem more potent than others, and all of which contributed to the hectic trading. But the chaos seen in the week of February 5, really begun the week before.
It all started with the USA January jobs report of Friday, 2, 2018, which showed that more jobs were added to the economy than expected during the first month of the year while wage growth was also stronger than expected.
The post-jobs-report market stress continued into Monday, February 5, with the consequence that “higher rates” trade became the “higher volatility” trade.
Increase of the treasury bond yield:
Treasury yields continue to move to multi-year highs, strong wage data was seen by many as confirming bond market fears that inflation is coming to the U.S. economy this year.
The markets started to believe the Federal Reserve would have to be more aggressive in raising interest rates in 2018 and beyond.
The increase in interest rates that had been seen since the start of 2018, all at once, became a primary concern for the stock market.
Spiking VIX Index:
The VIX index, which tracks current and expected market volatility, spiked higher as the week’s first trading day drew to an end. In 2017, the VIX hit a record low of 8.64.
On Monday, February 5, in the afternoon the VIX index was at 50, to close at 37.33 as can be seen from below chart.
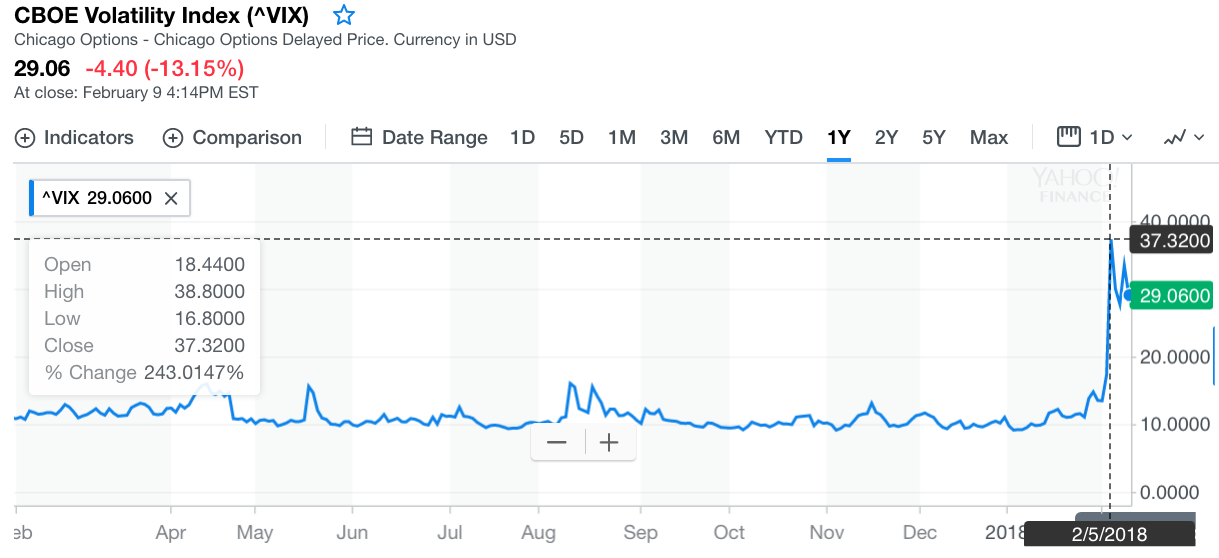
When trading closed on Monday February 5, the stock market was down about 4% with the Dow falling 1,175 points and Treasuries did not prove to be the safe haven many expect them to be in a market storm.
PGM CAPITAL ANALYSIS & COMMENTS:
After more than a year of steadily climbing, stocks spent the past six trading days all over the board.
The DOW fell officially into correction territory on Thursday February 8, down more than 10 percent from its record high reached in January 26, as can be seen from below chart.
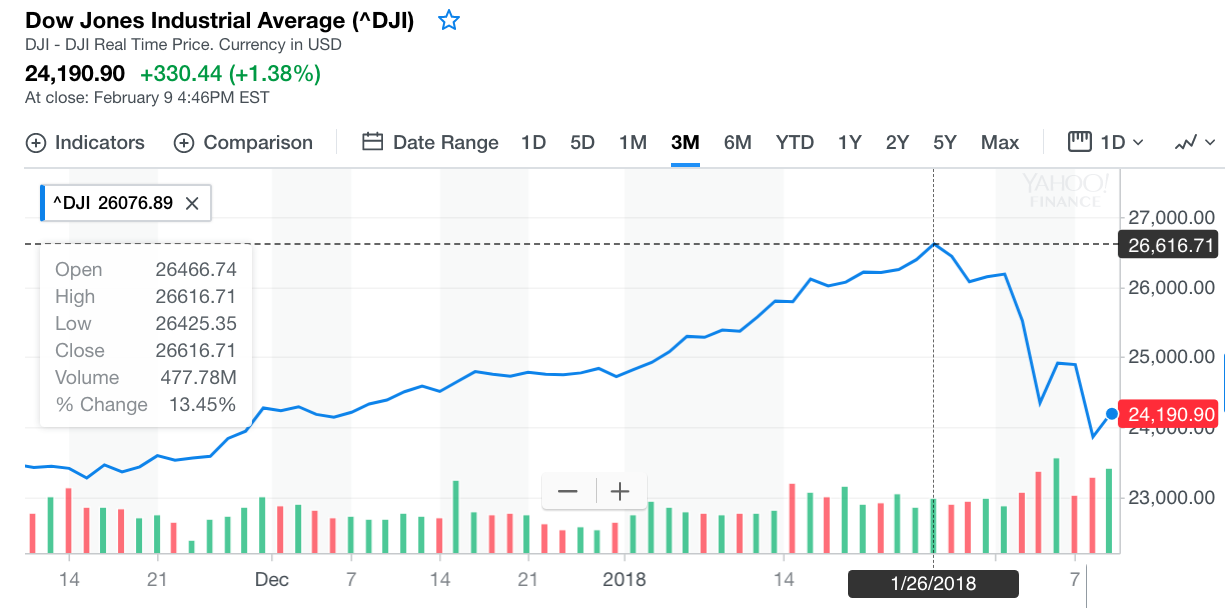
If this is just a run-of-the-mill correction, then we are looking at another four months of pain, history shows. If the losses deepen into a bear market (down 20 percent), then it could be 22 months before we revisit these highs, history shows.
The average bull market ‘correction’ is 13 percent over four months and takes just four months to recover.
Marijuana stocks bouncing back:
Cannabis stocks have been recovering in a big way in the week of February 5, and have closed the week on a big win, during the period of February 2 to February 9, 2018, as can be seen from below chart.
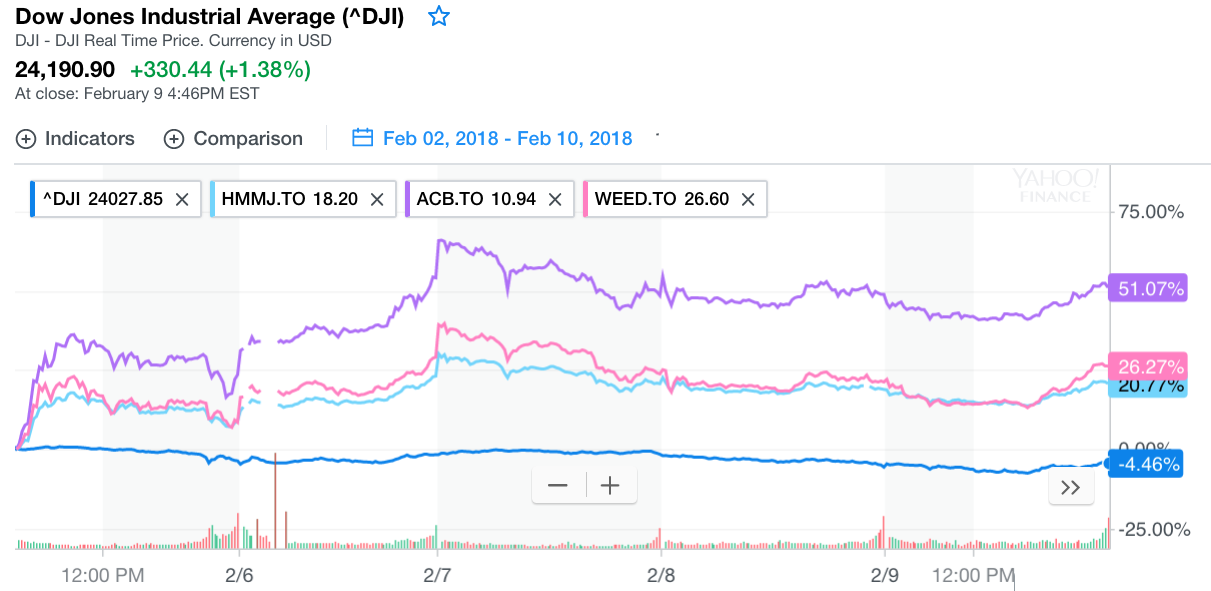
As can be seen from above chart, while the DOW (blue chart) ends the period of February 2 – 8 with a lost of 4.46 percent, the EFT tracking the Marijuana Index (light blue chart) (HMMJ.TO) appreciated with 20.77 percent, while the two heavy weight Cannabis Companies; Canopy (WEED.TO) and Aurora (ACB.TO) respectively the pink and purple chart appreciated with respectively 26.67 and 51.07 in the same above mentioned period.
Bond got Hammered:
As can be seen from below chart, the bond market got hammered YTD, increasing the yield of the USA 10-year note, with 36.4 basis points or 14.8 percent.
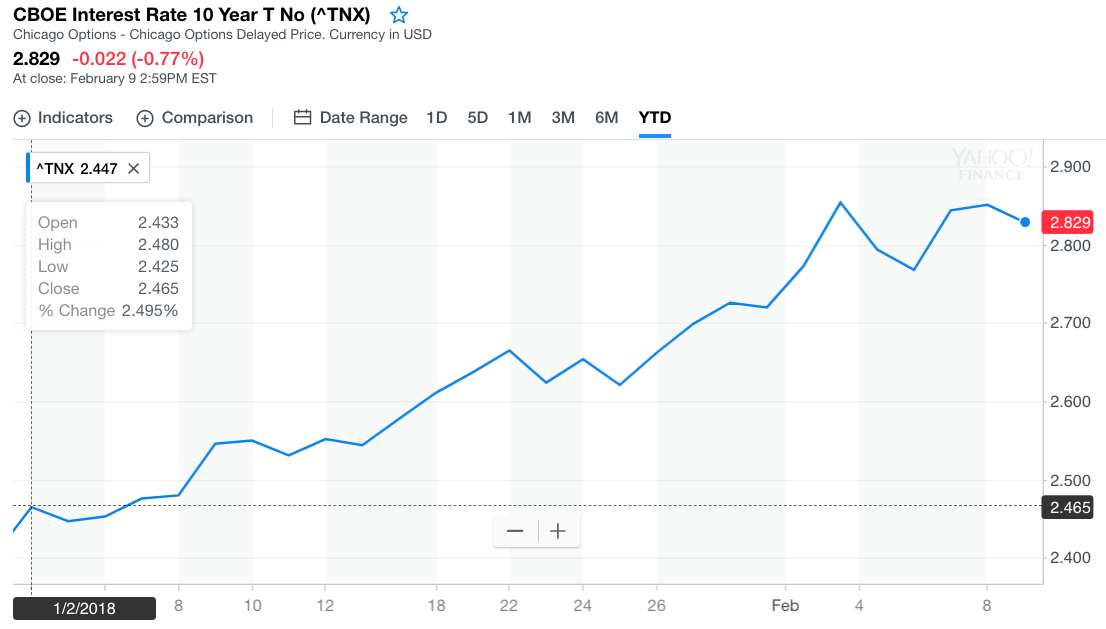
In the past we have warned very frequently bond investors for a coming crash of the bond market, by not investing in bonds with a coupon below real inflation which are trading above their parity value.
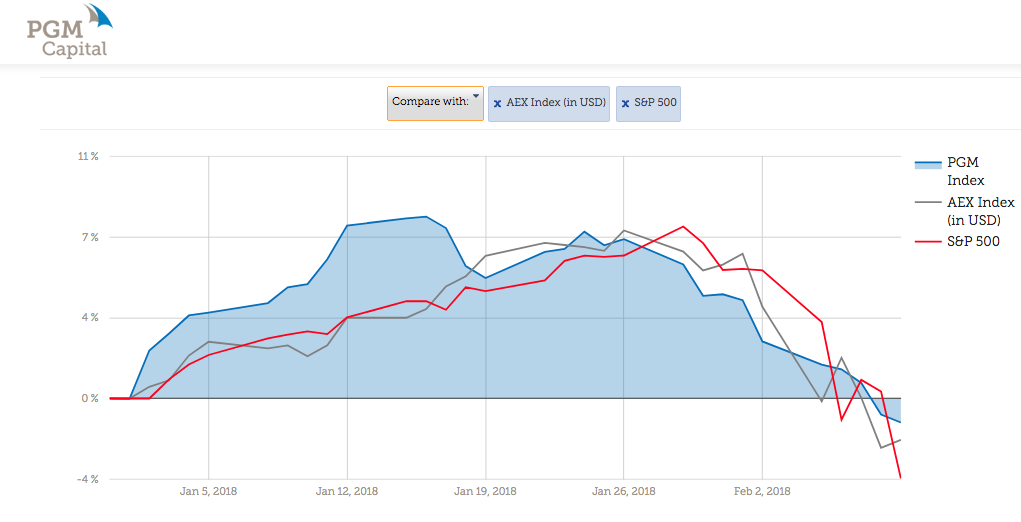
The PGM Capital Component Index:
As can be seen from below chart YTD, the PGM component, has outperformed – thanks to its exposure to Marijuana Stock and limited bond investments – the S&P-500 as well as the AEX (measured in USD).
PGM Capital, your trusted Investment Advisor and financial planner, is at your service, as the captain of your nest egg, with our best advice during these difficult times on the global Capital Markets.

Last but not least, before taking any investment decision, always take your investment horizon and risk tolerance into consideration and keep in mind that share prices don’t move in a straight line and that Past Performance Is Not Indicative Of Future Results.
Yours sincerely,

Eric Panneflek