Dear PGM Blog reader,
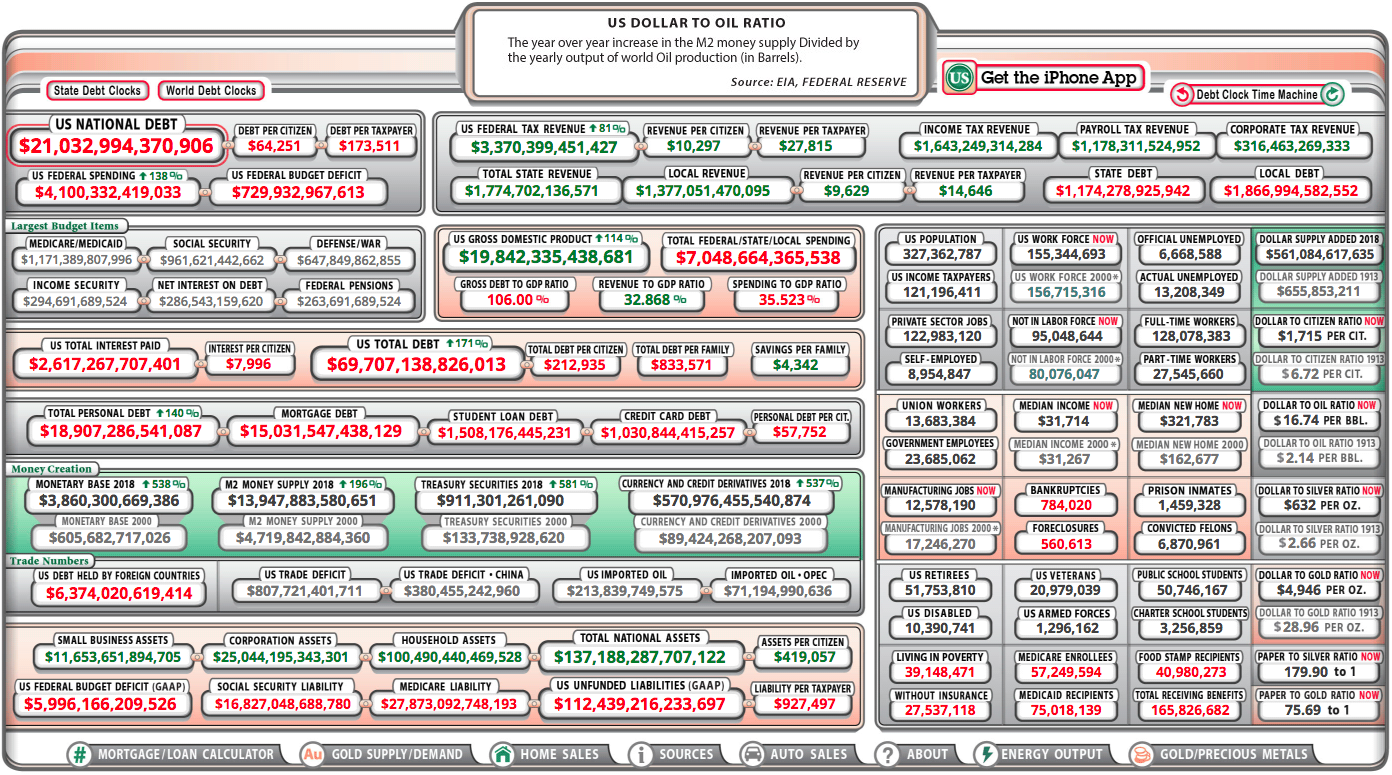
In this weekend blog article, we want to take the opportunity to discuss with you, the fact that on Thursday, March 15, the USA National Debt, exceeded U$21 trillion for the first time, a little more than six months after it hit first US$20 trillion on September 8, 2017.
The USA government releases total debt figures each business day, but it lags by one day.
As can be seen from below figure, the national debt was US$21.031 trillion on Thursday.
INTRODUCTION:
The national debt of the United States is the debt carried by the federal government of the United States. The public debt is measured as the value of the currently outstanding Treasury securities that have been issued by the Treasury and other federal government agencies.
The terms national deficit and national surplus usually refer to the federal government budget balance from year to year, not the cumulative amount of debt.
There are two components of gross national debt:
- Debt held by the public, such as Treasury securities held by investors outside the federal government, including those held by individuals, corporations, the Federal Reserve System, and foreign, state and local governments.
- Debt held by government accounts or intragovernmental debt, such as non-marketable Treasury securities held in accounts of programs administered by the federal government, such as the Social Security Trust Fund.
In general, government debt increases as a result of government spending, trade deficits, and unpaid credit, and decreases from tax or other receipts.
PGM CAPITAL ANALYSIS & COMMENTS:
About a year ago, when President Trump took office, he pledged to eliminate the national debt “over a period of eight years.” But for the first time in history, the USA national debt surpassed US $21 trillion last week, according to the U.S. Treasury.
Below chart shows the development of the USA national debt since president Trump took office in January of last year.
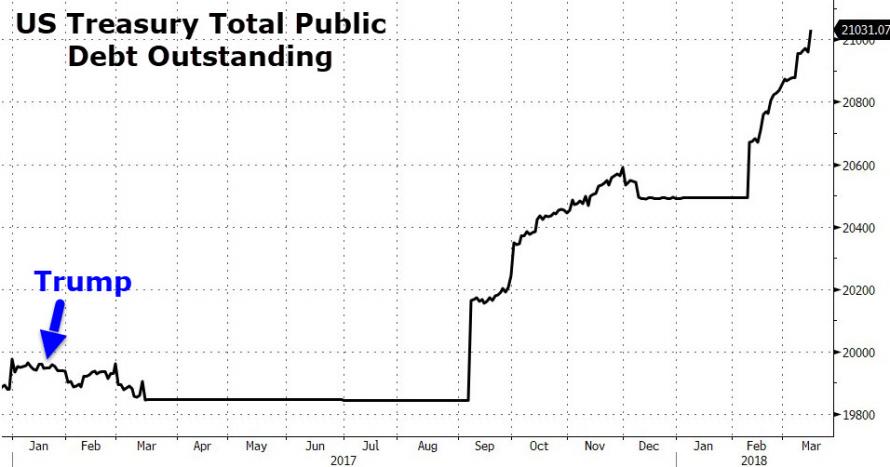
Putting this in context, total USA debt has now risen by over US$1 trillion in Trump’s first year in office.
The USA Federal borrowing has been on the rise again since February, when Congress passed legislation to suspend the debt ceiling, which allowed the USA government to borrow as much as it needs to fund the activities approved by Congress.
Under the law passed in February, the USA government will not face any borrowing limit until March 1, 2019. At its current pace, the USA government is on track to add at least US$1 trillion to the national debt by then.
Outlook:
Below chart of the USA Congressional Budget Office (CBO) shows that the USA debt is on an unsustainable path, which if the USA doesn’t take measures to control it, it will reach 150% of GDP by 2047.
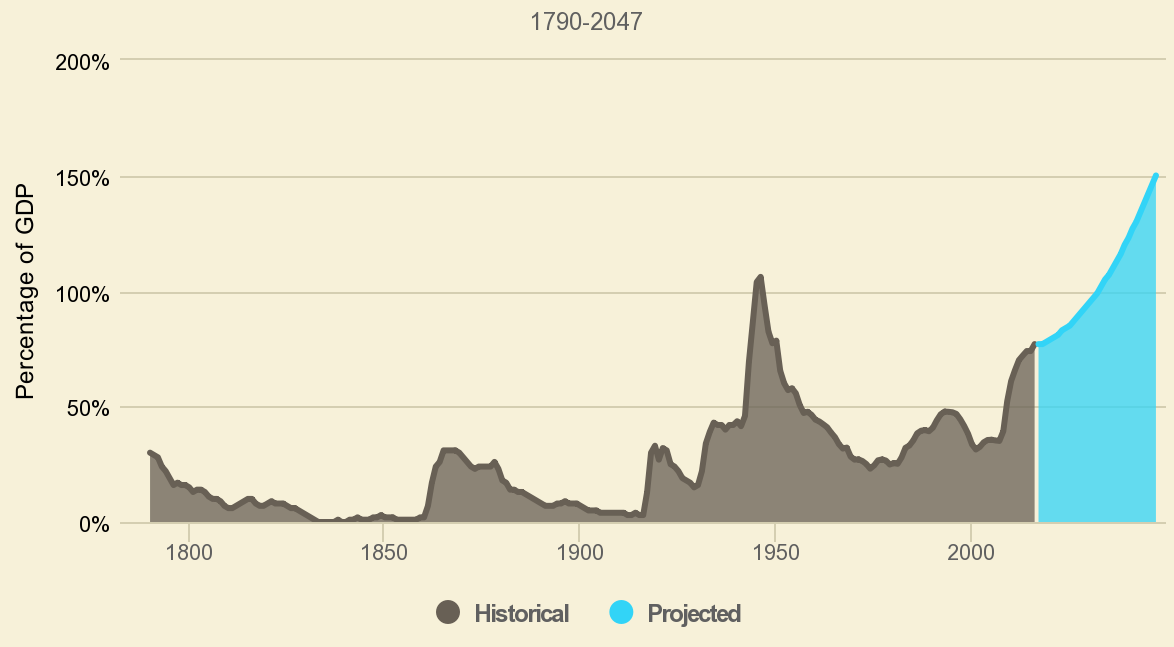
Source: CBO Long Term USA Budget Outlook (March 2017)
According with the CBO, the USA federal debt is projected to grow more quickly than the economy and eventually reach levels substantially higher than at any point in the nation’s history.
If that happens, government borrowing will soak up private savings that would otherwise be invested in increasing worker productivity.
This process creates a drag on the economy that can lead to lower wages and living standards.
Below table shows the USA gross federal debt by year for the last decade:
|
|||||||||||||||||||||||||||||||||||
Without trying to mingle into internal USA politics, we believe that if the USA doesn’t reverse the trend, this unsustainable level of debt to GDP of the country, will lead to an increase of interest rates, which will have a negative effect on housing market and the general economy.
Based on these assumptions, we are cautious in holding US-Treasuries at current interest rate, because future higher interest will have a devastating effect on the market value of these treasuries.
Last but not least, before taking any investment decision, always take your investment horizon and risk tolerance into consideration and keep in mind that; share prices don’t move in a straight line and that Past Performance Is Not Indicative Of Future Results.
Yours sincerely,

Eric Panneflek