Dear PGM Capital blog readers,
In this weekend blog edition, we want to discuss some of the most important events that happened in the global capital markets, the world economy and the world of money in the week of June 5, 2017:
- Gold Backed ETFs Holding Increased with 10.5 Tonnes in May.
- NASDAQ Slumps 1.8 percent on Friday, June 9 and post worst week of the year.
GOLD BACKED ETFs HOLDINGS INCREASED WITH 10.5 TONNES IN MAY:
Gold backed Exchange Traded Funds (ETFs) are securities designed accurately to track the price.
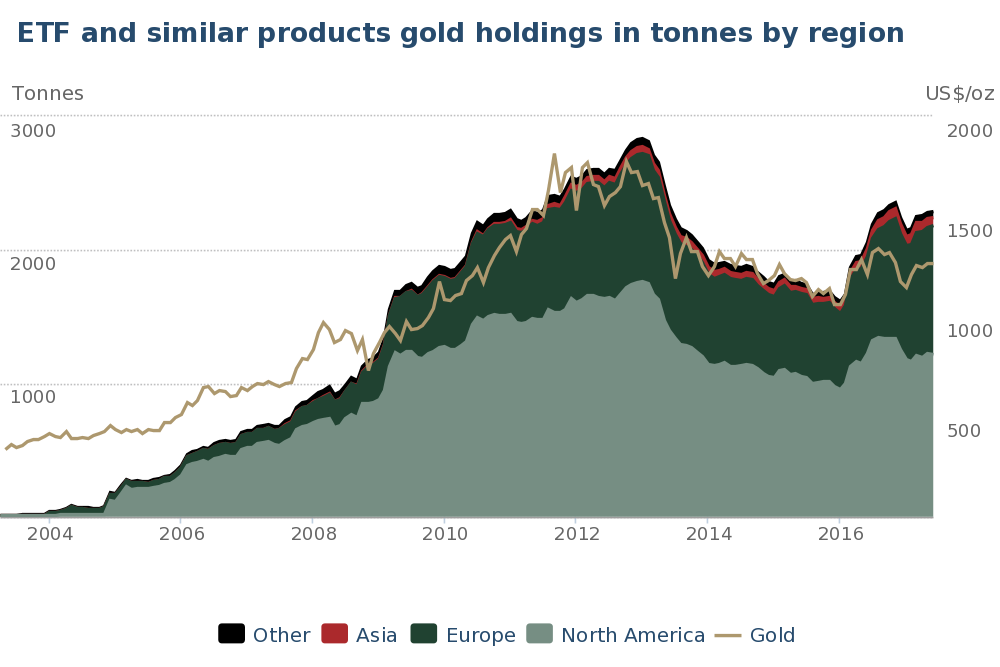
According with data from World Gold Council, released on June 8, 2017, total holdings in gold-backed exchange-traded funds (ETFs) increased 10.5 Tones in May to 2,291.9 Tonnes or 73.7-million ounces, as can be seen from below chart.
Highlights:
- European inflows more than doubled the North American outflows: holdings increased 20.8 Tonnes (+2%) to 967.2 in Europe, while North American funds lost 7.2 Tonnes to 1,214.0 Tonnes Asian funds shed 2.0 Tonnes (-3%) to 64.5Tonnes and funds in the other region lost 1.1 Tonnes to 46.1 Tonnes.
- In Europe, Germany contributed over half of the increase through db Physical Gold Euro Hedged (36.2 Tonnes) (XAD1) and db Physical Gold (18.2 Tonnes) (XGLD.L). Funds in the United Kingdom and Switzerland also saw increases of smaller magnitude.
- In North America, holdings under SPDR Gold Shares (GLD) lost 5.9 Tonnes to 847.5 Tonnes, in May while iShares Gold Trust (IAU) shed 1.4 Tonnes to 203.0 Tonnes.
NASDAQ SLUMPS 1.8 PERCENT ON FRIDAY JUNE 9:
The Nasdaq slumped 113.5 points or 1.8% on Friday, retreating from an early record and turning sharply lower for the week, as can be seen from below chart.
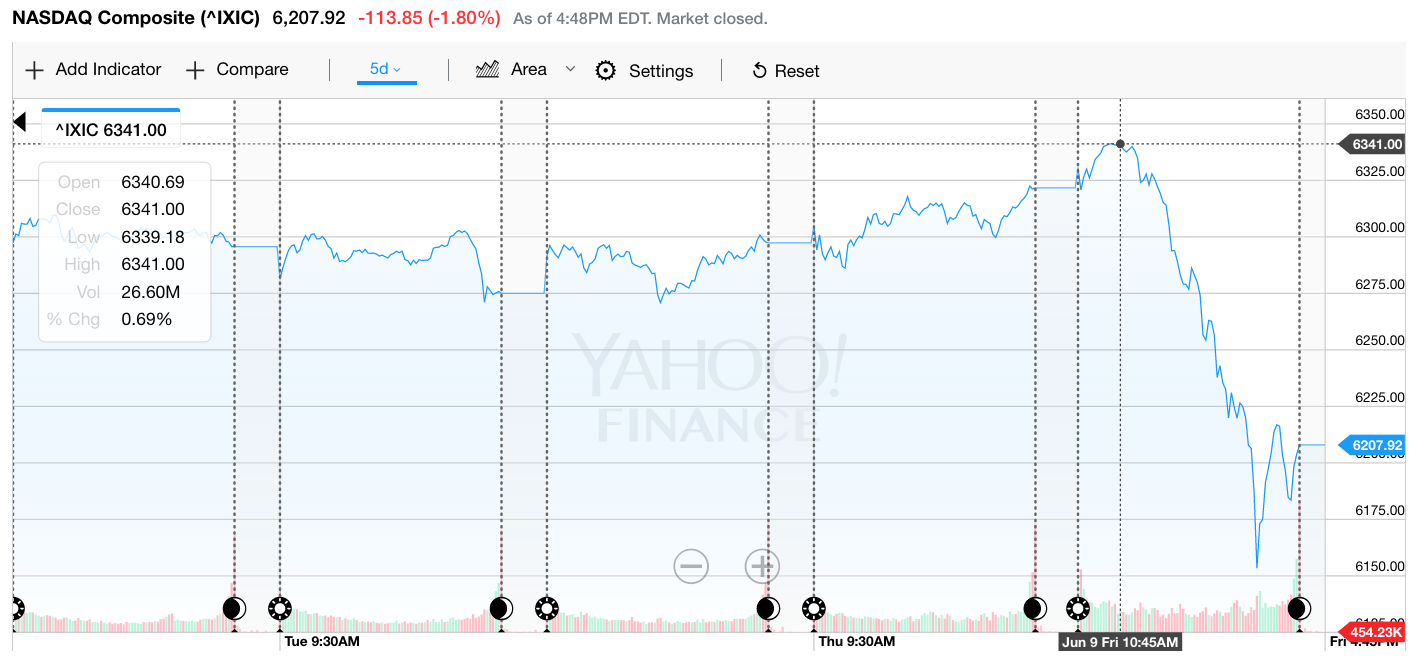
As can be seen from above chart, the Nasdaq had moved higher in morning trading, at one point trading as high as 6,341.70, meaning an intraday swing of more than 200 points.
Friday, June 9, marked the biggest one-day decline for the Nasdaq since May 17, when it tumbled more than 2.5%.
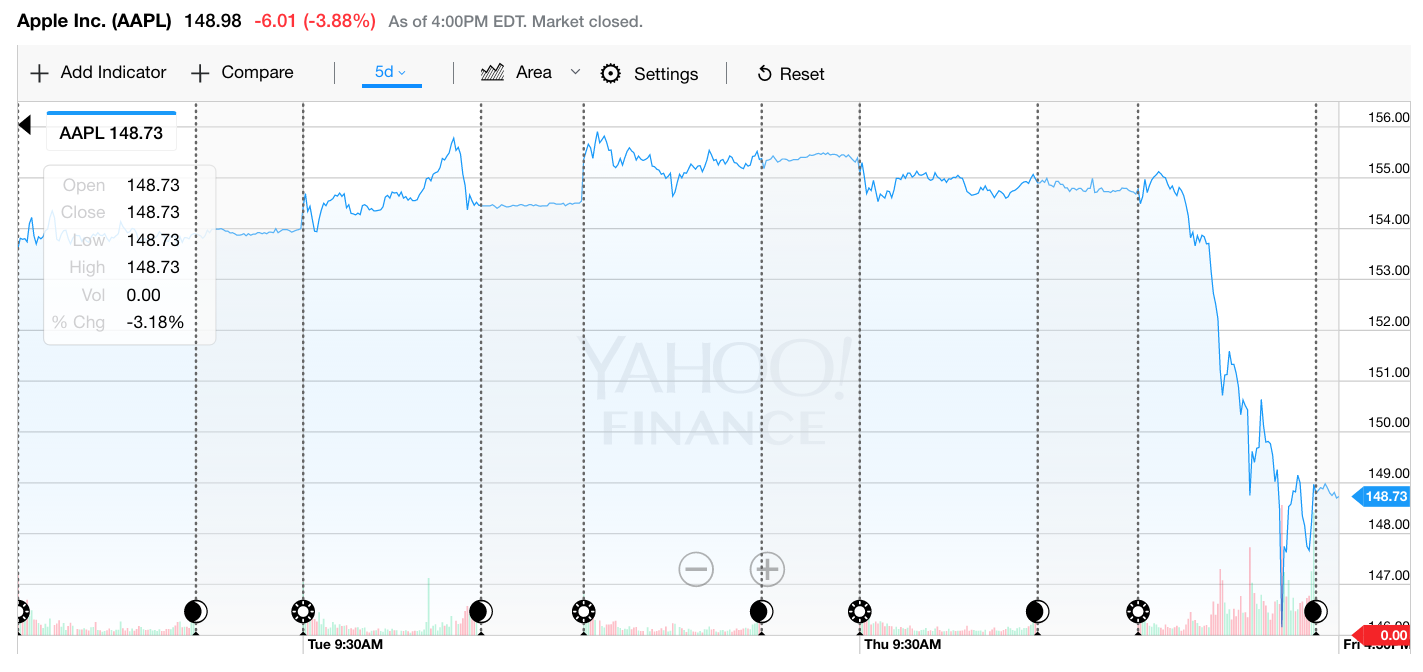
Tech Bellwether Apple Inc. (Nasdaq: AAPL) tumbled 3.88 percent, as can be seen from below chart, its biggest one-day drop since April 2016.
Other Tech giants like Alphabet Inc (NASDAQ: GOOG) – the parent of Google -, Facebook (NASDAQ: GB) and Amazon.com Inc fell respectively; 3.41 percent, 3.30 percent and 3.16 percent.
Momentum names like Priceline (NASDAQ: PCLN) and Tesla (NASDAQ: TSLA) also took a hit, falling 2.66 percent and 3.43 percent, respectively.
PGM CAPITAL ANALYSIS & COMMENTS:
GOLD ETF Holdings Increased:
Gold is seen as a portfolio diversifier largely because of it usually does not respond to external stimuli that would normally affect equities and fixed-income assets. A lower correlation between the asset classes would lower overall portfolio volatility and therefore increase portfolio diversification and enhance the overall risk-adjusted return of a portfolio.
Gold has historically been used to provide tail risk mitigation during times of market stress, rising during periods of stock market pullbacks, notably so-called black swan events like most recent financial depression. This ability to act as a tail risk hedger provides investors with a means of diminishing market volatility and reducing the magnitude of potential drawdowns within a portfolio.
Lastly, gold has traditionally acted as an inflation hedge, with a long track record of offering protection of purchasing power in varying inflationary environments. Since 1970, gold prices have increased at an average 6.7% rate when the annual rate of inflation in the U.S. has been below 2%. During periods of moderate inflation of 2% to 5%, gold has increased at an average rate of 7.4% per year. When inflation spikes persists at 5% a year, gold returned an average annual rate of 15.2%.
The best way for the retail investor to own gold is via Gold backed ETFs for which based on the points as mentioned here above, the average portfolio, dependable on financial situation, age and risk tolerance should have between 10 – 30 percent of the portfolio invested in Gold and other precious metals.
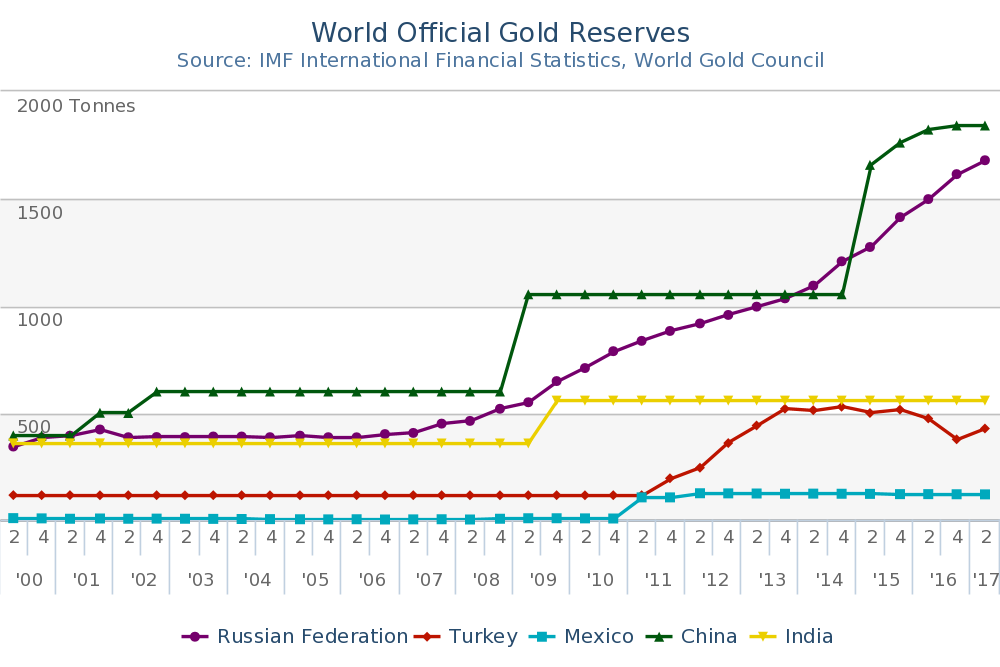
Central banks have been net bullion buyers every year since 2008, adding more than 2,800 tonness or 9.4% to reserves. Developed countries (accounting for the lion’s share of total official holdings) have been conserving stocks, while developing countries led by China and Russia have been building them up. as can be seen from below chart.
The Friday June 9, 2017 Sell Off:
NASDAQ:
The tech selloff also triggered a return in market turbulence with the CBOE Volatility Index VIX, +5.31% spiking more than 5% to 10.70. Wall Street’s so-called fear index had earlier sank to 9.37, the lowest since December 1993.
Other markets:
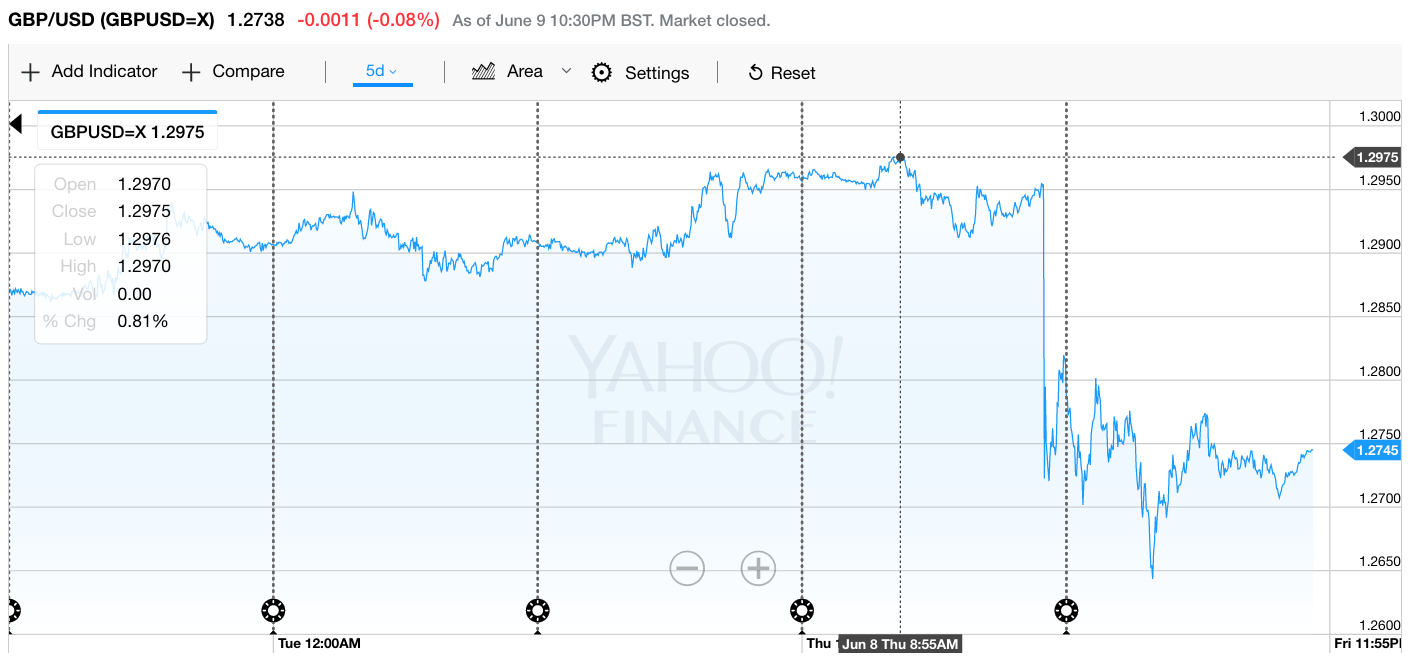
As can be seen from below chart. the British pound (GBPUSD) sank to a seven-week low against the dollar, dropping to $1.2739 from $1.2957 in late trading on Thursday after Britain’s snap election left Prime Minister Theresa May clinging to power after her Conservative party failed to secure a parliamentary majority.
We believe that the USD as well as US-Markets are overvalued and that the sudden sell-off of the NASDAQ of last Friday, might just be an indication for what is coming for both the USD as well as the US-Markets.
Regarding the GBP sell off against the USD, we believe that this sell off will give investors who want to pick up prime UK multinationals a good entry window.
Until Next time

Eric Panneflek