Dear PGM Capital, blog readers,
In this belated weekend’s blog edition, we wish to elaborate, why investing in Kellogg’s can be lucrative for value investors.
INTRODUCTION:
The Kellogg Company (NYSE: K), – doing business as Kellogg’s,- is a leading American producer, that together with its subsidiaries, manufactures and markets ready-to-eat cereal and convenience foods.
The company operates through four segments: North America, Europe, Latin America, Asia. Middle East and Africa.
The company was founded as the Sanitas Food Company in 1900 by the brothers W.K. Kellogg and Dr. John H. Kellogg. Together they developed a method of producing crunchy, flavorful flakes of processed grain that proved a popular breakfast food among the patients at Dr. Kellogg’s Battle Creek Sanitarium.
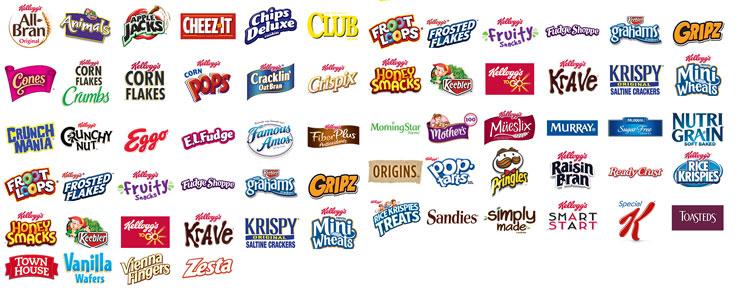
Its principal products include crackers, crisps, savory snacks, toaster pastries, cereal bars and bites, granola bars and bites, ready-to-eat cereals, frozen waffles, veggie foods, and noodles.
The company offers its products under the Kellogg’s, Cheez-It, Pringles, Austin, Parati, RXBAR, Kashi, Bear Naked, Eggo, Morningstar Farms, Choco Krispies, Crunchy Nut, Nutri-Grain, Special K, Squares, Zucaritas, Sucrilhos, Pop-Tarts, K-Time, Sunibrite, Split Stix, Be Natural, LCMs, Coco Pops, Frosties, Rice Krispies Squares, Kashi Go, Vector, Incogmeato, Veggitizers, and Gardenburger brand names.
The company is headquartered in Battle Creek, Michigan, and its shares are trading on the NYSE under the symbol K.
YEAR 2020 TOP 30 FOOD & BEVERAGE COMPANIES:
The Food Engineering Top 100 Food and Beverage companies is compiled by an independent researcher based on the most up-to-date financial information possible.
As shown in the table below, the top 5 F&B companies; -Nestlé, PepsiCo, Anheuser-Busch InBev, JBS and Tyson Foods, in order -, are the same. It should be noted that although there was some movement in spots 6-10, the companies in those spots have been around the top 10 range for several years.
| Rank: 2020 | 2019 | Company | Year end | Food revenue (In U.S. $B) 2020 | 2019 |
|---|---|---|---|
| 1 | 1 | Nestle | Dec-19 | 76.802 | 80.195 |
| 2 | 2 | PepsiCo, Inc. | Dec-19 | 67.161 | 64.661 |
| 3 | 3 | Anheuser-Busch InBev | Dec-19 | 52.329 | 54.619 |
| 4 | 4 | JBS | Dec-19 | 48.795 | 46.79 |
| 5 | 5 | Tyson Foods | Oct-19 | 42.405 | 40.052 |
| 6 | 7 | Mars | Dec-19 | 37.63 | 35 |
| 7 | 9 | The Coca-Cola Company | Dec-19 | 37.266 | 31.856 |
| 8 | 6 | Archer Daniels Midland Company | Dec-19 | 32.951 | 38.9 |
| 9 | 8 | Cargill | May-19 | 31.7 | 32.5 |
| 10 | 14 | Danone | Dec-19 | 28.322 | 20.83 |
| 11 | 17 | Heineken | Dec-19 | 26.845 | 18.99 |
| 12 | 11 | Mondelez International | Dec-19 | 25.868 | 25.938 |
| 13 | 10 | Kraft Heinz Company | Dec-19 | 24.977 | 26.259 |
| 14 | 12 | Smithfield Foods/WH Group | Dec-19 | 23.346 | 21.283 |
| 15 | 19 | Unilever | Dec-19 | 21.6 | 17.095 |
| 16 | 13 | Suntory | Dec-19 | 21.46 | 20.855 |
| 17 | 15 | Olam International | Dec-19 | 21.137 | 19.365 |
| 18 | 22 | Lactalis | Dec-18 | 20.72 | 15.635 |
| 19 | 18 | Asahi Group | Dec-19 | 19.084 | 18.77 |
| 20 | 16 | CHS Inc. | Aug-19 | 18.9 | 19.2 |
| 21 | 20 | General Mills Inc. | May-19 | 16.865 | 16.865 |
| 22 | 21 | Diageo | Jun-19 | 16.368 | 16.177 |
| 23 | 26 | Dairy Farmers of America | Dec-19 | 15.86 | 13.6 |
| 24 | 23 | Grupo Bimbo (Mexico) | Dec-19 | 15.1 | 15 |
| 25 | 24 | Kirin Holdings | Dec-19 | 15.01 | 14.27 |
| 26 | 27 | Kellogg Company | Dec-19 | 13.578 | 13.547 |
| 27 | 38 | Coca-Cola European Partners | Dec-19 | 13.46 | 9.735 |
| 28 | 25 | Fonterra | Jul-19 | 13.26 | 14.195 |
| 29 | 29 | Yili Group | Dec-19 | 13.065 | 12.035 |
| 30 | 45 | Ferrero | Aug-19 | 12.768 | 9.043 |
The above table shows, that in the year 2020, Kellogg’s was ranked 26th among the world’s biggest F&B companies based on its revenue.
PGM CAPITAL COMMENTS & ANALYSIS:
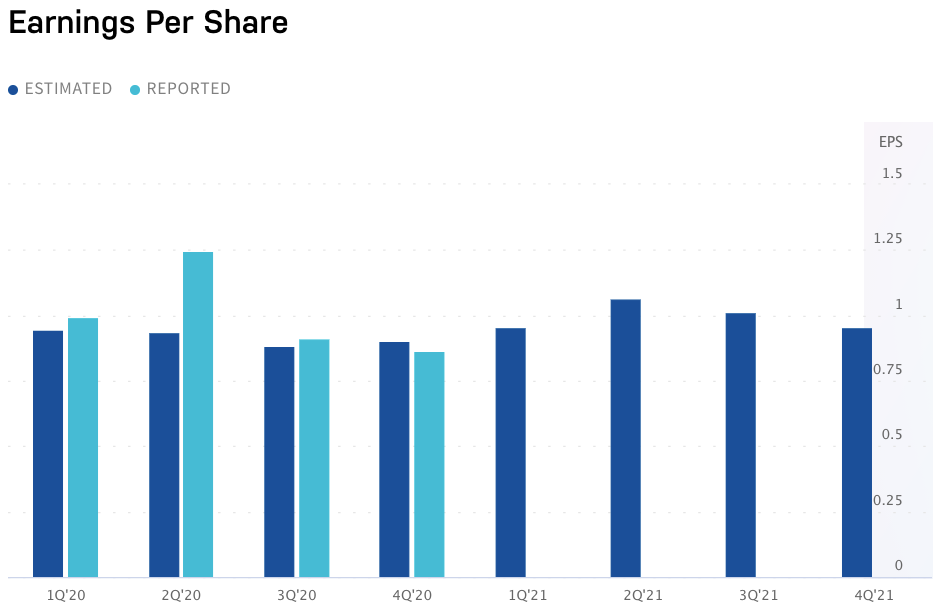
Kellogg Company is expected* to report earnings on Thursday, May 6, 2021, before market open. The report will be for the fiscal Quarter ending March 31, 2021. According to Zacks Investment Research, based on 9 analysts’ forecasts, the consensus EPS forecast for the quarter is US$0.95.
The reported EPS for the same quarter last year was US$0.99.
Kellogg’s declares Q2-2021 Dividend:
The Kellogg Company announced that its Board of Directors declared a dividend of US$0.58 per share on the common stock of the Company, payable on June 15, 2021, to share-owners of record at the close of business on June 1, 2021. The ex-dividend date is May 28, 2021. As the company previously announced in February, this reflects a 2 percent increase to the quarterly dividend. This is the 386th dividend that Kellogg Company has paid to owners of common stock since 1925, for which it has increased its dividend for more than 25 years consecutive, for which reason Kellogg’s share can be labeled as a dividend aristocrat.
The table below shows that the company has increased its dividend, from US$ 0.46 per share per quarter in 2013 to US$ 0.58 per share in 2021, an increase of 26% in 8 years.
| Ex/EFF DATE | TYPE | CASH AMOUNT | DECLARATION DATE | RECORD DATE | PAYMENT DATE |
|---|---|---|---|---|---|
| 03/01/2021 | CASH | $0.57 | 02/11/2021 | 03/02/2021 | 03/15/2021 |
| 11/30/2020 | CASH | $0.57 | 10/23/2020 | 12/01/2020 | 12/15/2020 |
| 08/31/2020 | CASH | $0.57 | 07/24/2020 | 09/01/2020 | 09/15/2020 |
| 05/29/2020 | CASH | $0.57 | 04/24/2020 | 06/01/2020 | 06/15/2020 |
| 03/02/2020 | CASH | $0.57 | 02/21/2020 | 03/03/2020 | 03/16/2020 |
| 11/29/2019 | CASH | $0.57 | 10/18/2019 | 12/02/2019 | 12/16/2019 |
| 08/30/2019 | CASH | $0.57 | 07/26/2019 | 09/03/2019 | 09/13/2019 |
| 05/31/2019 | CASH | $0.56 | 04/26/2019 | 06/03/2019 | 06/14/2019 |
| 03/04/2019 | CASH | $0.56 | 02/22/2019 | 03/05/2019 | 03/15/2019 |
| 11/30/2018 | CASH | $0.56 | 10/19/2018 | 12/03/2018 | 12/17/2018 |
| 08/31/2018 | CASH | $0.56 | 07/27/2018 | 09/04/2018 | 09/17/2018 |
| 05/31/2018 | CASH | $0.54 | 04/27/2018 | 06/01/2018 | 06/15/2018 |
| 03/02/2018 | CASH | $0.54 | 02/16/2018 | 03/05/2018 | 03/15/2018 |
| 11/30/2017 | CASH | $0.54 | 10/20/2017 | 12/01/2017 | 12/15/2017 |
| 08/30/2017 | CASH | $0.54 | 07/31/2017 | 09/01/2017 | 09/15/2017 |
| 05/30/2017 | CASH | $0.52 | 04/28/2017 | 06/01/2017 | 06/15/2017 |
| 02/27/2017 | CASH | $0.52 | 02/17/2017 | 03/01/2017 | 03/15/2017 |
| 11/29/2016 | CASH | $0.52 | 10/24/2016 | 12/01/2016 | 12/15/2016 |
| 08/30/2016 | CASH | $0.52 | 07/29/2016 | 09/01/2016 | 09/15/2016 |
| 05/27/2016 | CASH | $0.50 | 04/29/2016 | 06/01/2016 | 06/15/2016 |
| 02/26/2016 | CASH | $0.50 | 02/19/2016 | 03/01/2016 | 03/15/2016 |
| 11/27/2015 | CASH | $0.50 | 10/23/2015 | 12/01/2015 | 12/15/2015 |
| 08/28/2015 | CASH | $0.50 | 07/24/2015 | 09/01/2015 | 09/15/2015 |
| 05/28/2015 | CASH | $0.49 | 04/24/2015 | 06/01/2015 | 06/15/2015 |
| 03/04/2015 | CASH | $0.49 | 02/20/2015 | 03/06/2015 | 03/18/2015 |
| 11/26/2014 | CASH | $0.49 | 10/24/2014 | 12/01/2014 | 12/15/2014 |
| 08/28/2014 | CASH | $0.49 | 07/25/2014 | 09/02/2014 | 09/15/2014 |
| 05/29/2014 | CASH | $0.46 | 04/25/2014 | 06/02/2014 | 06/16/2014 |
| 03/04/2014 | CASH | $0.46 | 02/24/2014 | 03/06/2014 | 03/17/2014 |
| 11/27/2013 | CASH | $0.46 | 10/28/2013 | 12/02/2013 | 12/16/2013 |
| 08/29/2013 | CASH | $0.46 | 07/29/2013 | 09/03/2013 | 09/16/2013 |
The chart below of the shares of the company, shows that the share price is currently at a hard support line of approx. US$ 62 per share.
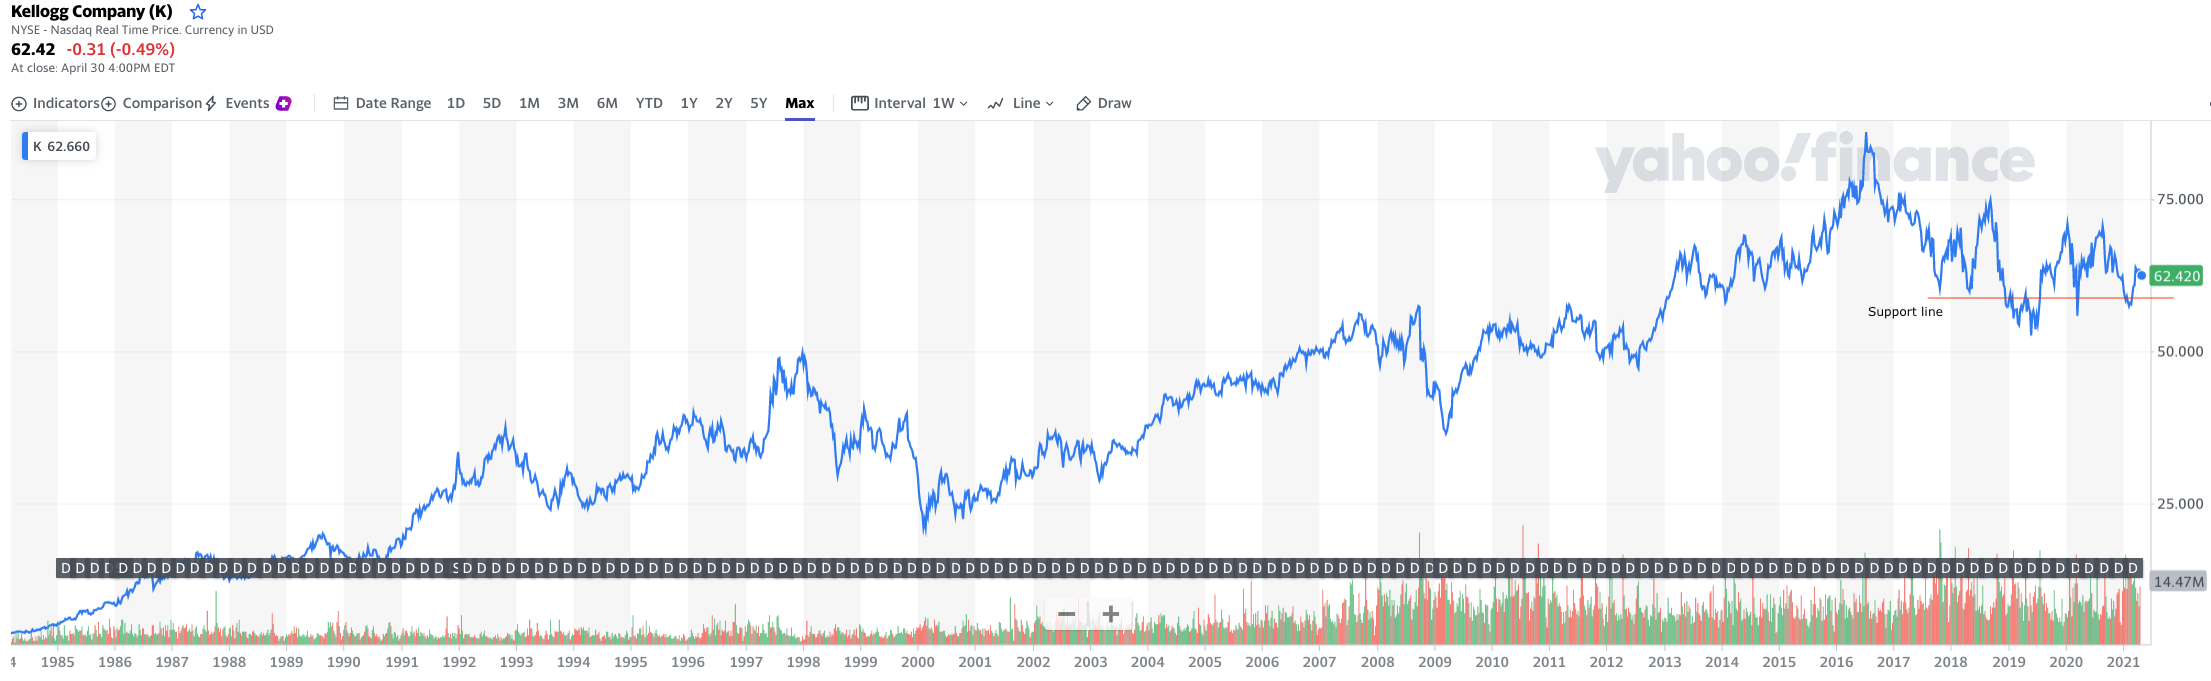
Based on the fundamentals of Kellogg’s, we have a BUY rating on the shares of the company.
Disclosure:
We do not own shares of Kellogg’s in our personal portfolio.
In this rapidly changing world and subsequent turbulence, PGM Capital is at your service as your Professional, Trustworthy, Dedicated, Financial Advisor and Asset Management.
Last but not least, before taking any investment decision, always take your investment horizon and risk tolerance into consideration. Keep in mind that share prices do not move in a straight line. Past performance is no guarantee of future results.
Yours sincerely,

Eric Panneflek